How Virus Spending Became the New Virus
The retail sales report for March brought more evidence that Biden’s $1.9 trillion American Rescue Plan of last March, which came on top of the $4 trillion of stimmies that had previously been distributed, was one of the worst fiscal policy measures of all time.
Even as of February 2021, household bank accounts were bulging with cash owing to the tsunami of prior stimmies, as well as the forced sabbatical from normal consumer spending at closed restaurants, bars, movies, gyms, resorts, hotels and much more.
That is to say, the US economy was well below so-called potential GDP owing to a government ordered supply-side contraction, not feeble actual and potential “demand.” Accordingly, the massive debt-fueled distribution of yet a third round of free stuff was the straw that broke the inflationary camel’s back.
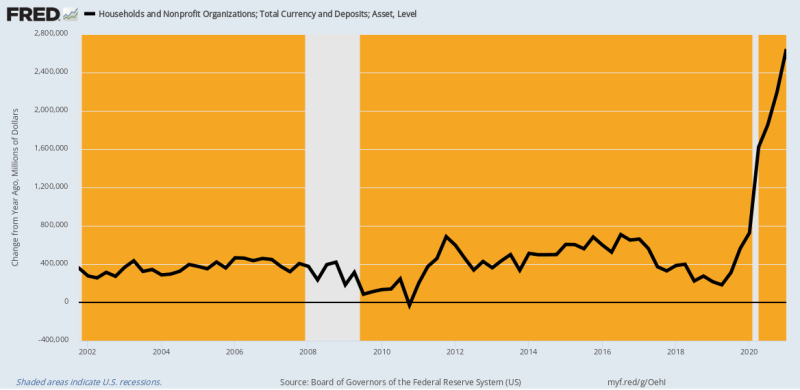
In fact, the chart below of household currency and bank deposits (checking, savings and time) tells you all they needed to know in February 2021. Compared to normal Y/Y growth of $400 billion to $600 billion, household cash and deposits had surged by $2.4 trillion in February 2021 versus prior year.
That is to say, households were already choking on excess cash and spendable resources. So why in the world did the Dems (and a lot of Republicans, too) think another $1400 per capita in stimmies and hundreds of billions of SBA walking around money was in any way warranted?
The answer, of course, is that the Washington/Wall Street consensus doesn’t know anything apart from “demand”. The facts screamed to the contrary, of course, meaning that the economic contraction could have been instantly resolved by tossing out Dr. Fauci and his Virus Patrol’s lockdowns, mandates, and Covid-scare-mongering. Yet they left Fauci to work his evil NPIs (non-pharmaceutical interventions) and jammed on the “demand” accelerator instead.
Y/Y Change In Household Currency And Deposits,2002-2021
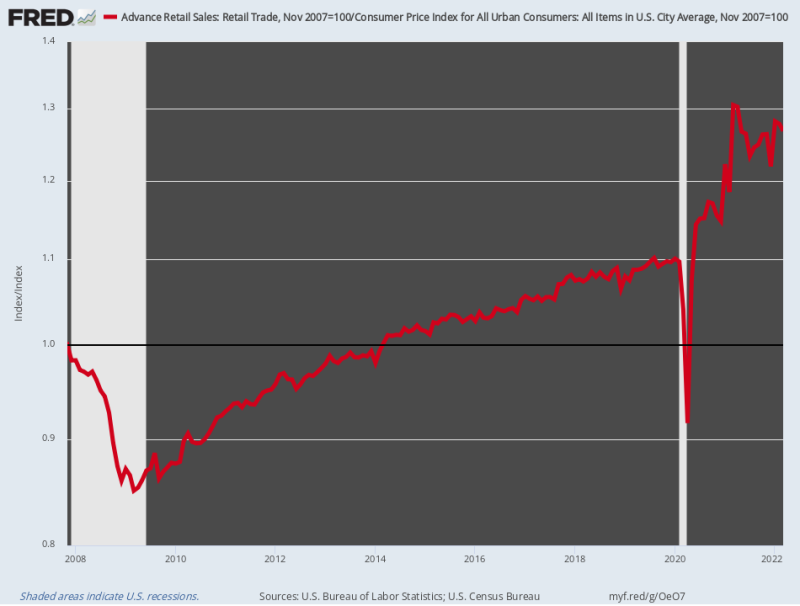
Not surprisingly, retail sales took off like a rocket. Whereas inflation-adjusted retail sales had grown by just 0.75% per annum between the November 2007 pre-crisis peak and February 2020, they then accelerated at a 17.2% per annum rate through March 20021. That staggering eruption was owing to the combined impetus of three consecutive stimmie rounds worth $6 trillion in barely 12 months.
Of course, the normal spending channels for services were heavily blocked by orders of the state—so both the money saved from not going to restaurants and bars plus the tsunami of free stuff from Washington got channeled into booming purchases of the Amazon-delivered merchandise goodswhich flow through the retail sector.
That is to say, in its wisdom Washington added massively to the public debt in order to ignite demand for merchandise that could not possibly be met by in-place vendors heavily dependent on foreign supply chains, which were being disrupted by the Covid-Lockdowns. And all for the purpose of making reported GDP a tad higher, even as the Virus Patrol kept the much larger supply-side of the services sector pinned to the mat.
In a word, the combination of government induced “supply-side” contraction and ultra-stimulated merchandise “demand” has no parallel for folly in the annals of Washington economic policy. It was a destructive eruption in a class all by itself, and the foundation for the runaway inflation now plaguing the American public.
Alas, the jig is now up. Inflation-adjusted retail sales in March were actually 2.9% below their year ago level and look to be heading in an increasingly southward direction as real incomes shrink and prices on the shelf continue to rise.
Index Of Inflation-Adjusted Retail Sales, 2007-2022
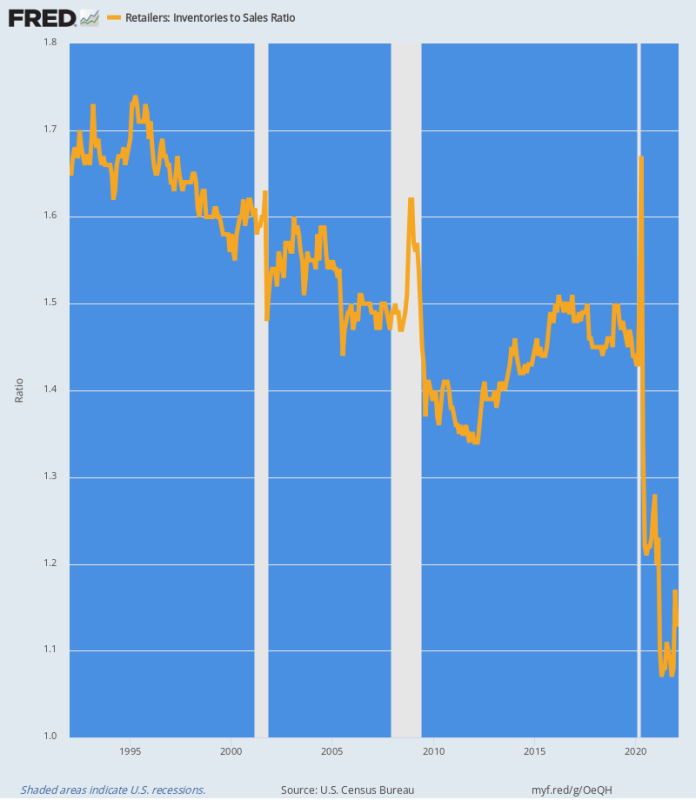
The dislocations to the supply chain resulting from Washington’s stimmy madness is starkly evident in the retail sector inventory-to-sales ratio. Essentially, the tsunami of demand for merchandise goods sucked inventories out of the system like a tornado going through a trailer park.
As shown in the chart below, the historical inventory-to-sales ratio was in the 1.4X to 1.7X range. But between March 2020 and June 2020, nearly $84 billion of retail inventories were sucked out of the system, a 13% reduction.
At the same time, retail sales were heading skyward, meaning that the inventory-sales ratio dropped into terra incognito. By April 2021 the ratio bottomed at a never before seen 1.07X and in the latest month (February) still stood at an ultra-low 1.13X.
The chart below is the foundation of the present inflationary eruption. It is a law of markets that when there is nothing on the shelves or in the warehouses, prices rise to clear the decks and induce the procurement of new supply. So until the historic ratios are recovered, retail prices are not likely to stabilize.
Retail Inventory-To-Sale Ratio, 1992-2022
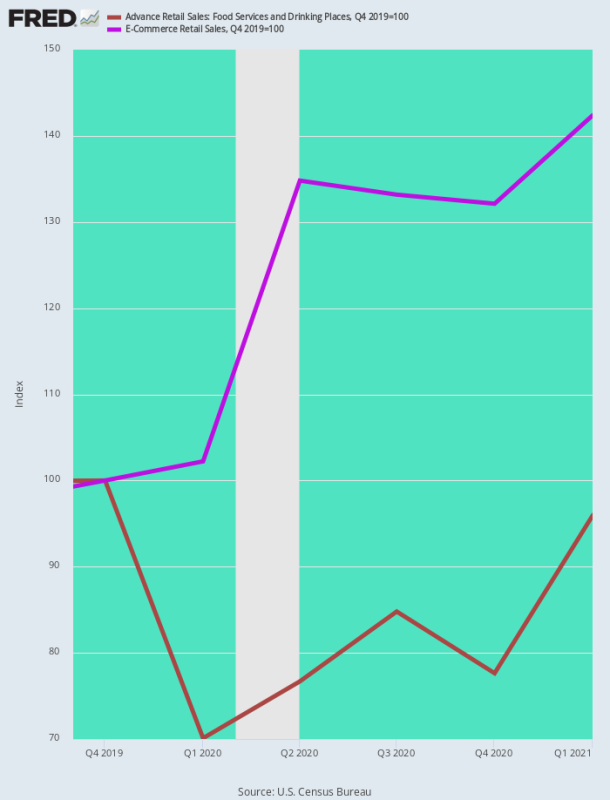
Another way to look at the inflationary surge in merchandise goods is to compare restaurant sales, the quintessential social congregation activity that was shutdown by the Virus Patrol, with e-Commerce sales, the go-to venue for consumer spending during the Covid.
No surprisingly, by Q1 2021 e-Commerce sales had soared by 42.4% from their pre-Covid level (Q4 2019), while restaurant sales had dipped by 20-30% during the early days of the lockdowns and were still nearly 5% below the pre-Covid level by the end of Q1 2021.
In effect, consumer spending got twisted like a pretzel owing to Washington instigated policies which were—
- Anti-growth on the services supply-side;
- Pro-spending on the merchandise goods demand side.
The result, of course, was a near instantaneous surge of inflation on the goods side, even as services prices initially deflated.
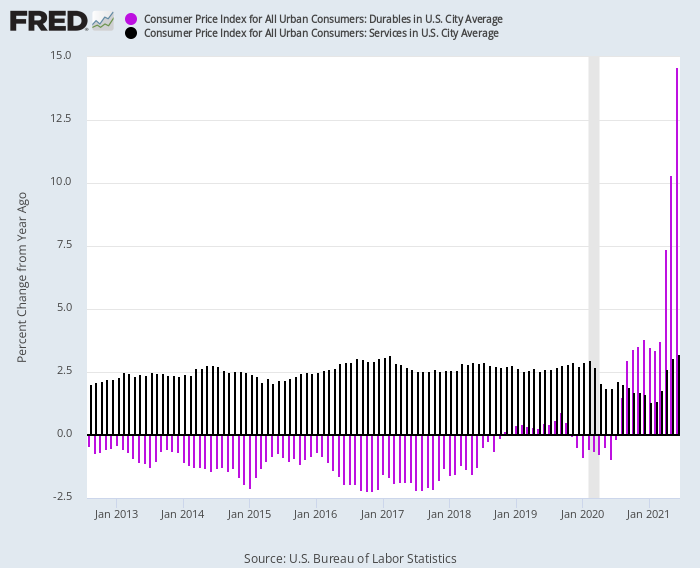
This reversal is dramatically depicted in the chart below. From 2012 through February 2020, the CPI for durable goods consistently posted at negative Y/Y rates in the 1-2% range (purple bars), while the CPI for services (dark bars) clocked in consistently in the +2.5% Y/Y range.
But after the Covid-Lockdowns hit, the indices flipped directions:
- Y/Y Services Price Index: Fell to as low as 1.3% by January 2021 due to the sharp contraction of activity;
- Y/Y Durable Goods Price Index: Soared to double digit gains by mid-2021 owing to the vast expansion of demand;
Y/Y Change in CPI for Durable Goods Versus Services, 2012-2021
The manner in which this goods versus services differential translated into second order wage inflation is also salient. In effect, Chinese and other foreign workers got the windfall from booming demand for goods, while low wage domestic workers were suddenly pleasured with double-digit wage growth.
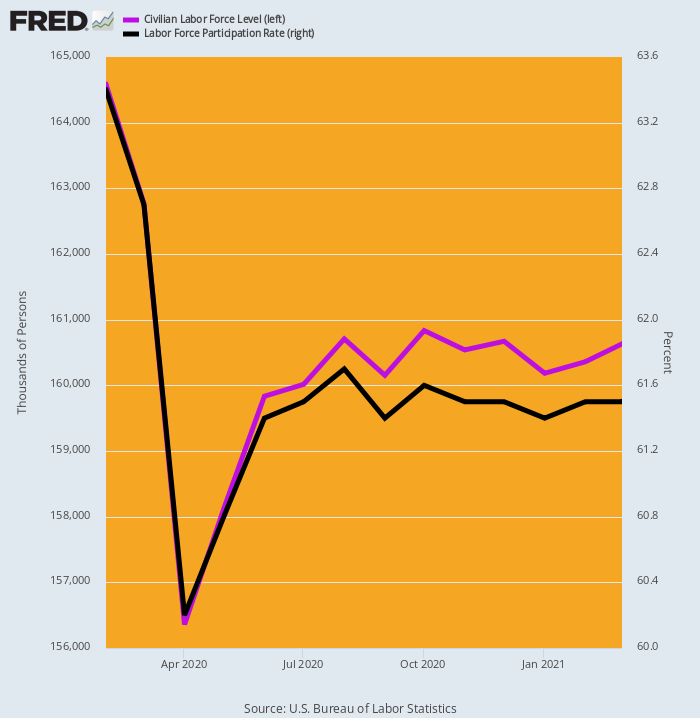
An apparent contributing cause was the impact of Washington’s free stuff on labor supply. As shown below, the BLS measured work force plunged by 8.2 million workers or 5% in April 2020 and then only slowly and partially recovered such that by the time of the third stimmy in March 2021 it was still nearly 4 million below the pre-Covid level.
Expressed in terms of the so-called labor force participation rate, the 63.4% level of February 2020 was still only 61.5% by March 2021.
Needless to say, most of that shrinkage of the work force occurred in the low-wage end of the labor market. There Washington’s $600 per week unemployment insurance minimum plus the three rounds of stimulus payments amounted to an annualized income of $45,000-–far above levels obtainable in the Leisure & Hospitality sector, for example.
Change In Civilian Labor Force And Participation Rate, February 2020-March 2021
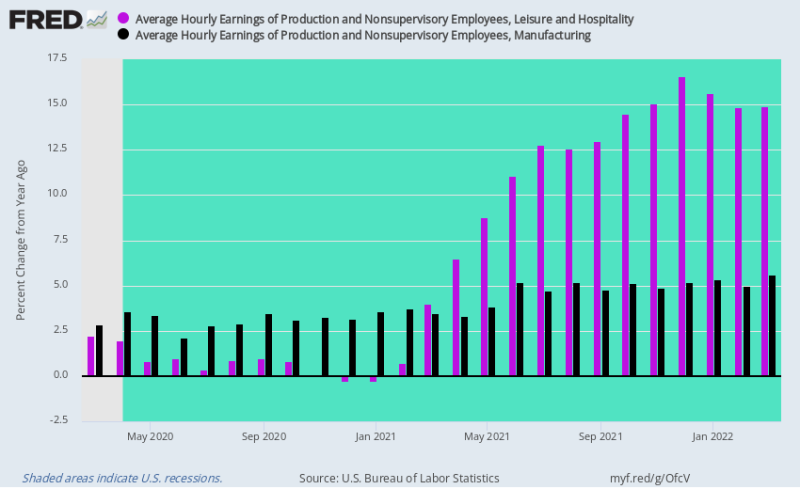
When the service sector of the US economy gradually re-opened in 2021, wage rates in the Leisure & Hospitality sector got goosed by a double-whammy. After the restaurant recession of 2020, demand came bounding back, even as the available work force had been materially reduced.
Accordingly, Y/Y wage rates took off like a rocket, rising by 14-16% in Q4 2021 when the $600 per week unemployment insurance and stimmy payments finally rolled off.
By contrast, wage rates in manufacturing, which had been rising by about 2-3% per year prior to the Covid-Lockdowns, accelerated very modestly to 4-5%. That is, they were still held down by the US economy’s massive reliance on foreign sourcing, albeit rapidly rising wage rates and costs in the China based supply chain provided some measure of relief.
Still, the important point is that the massive domestic stimmies and the Lockdown-caused twist of demand from services to merchandise goods introduced an inflationary cost-push pressure into the services sector, even as global supply chain disruptions and commodity surges caused the importation of roaring inflation in the merchandise goods sectors.
It was effectively the perfect inflationary storm.
Y/Y Change In Hourly Earnings, Leisure & Hospitality Versus Manufacturing, March 2020 to March 2022
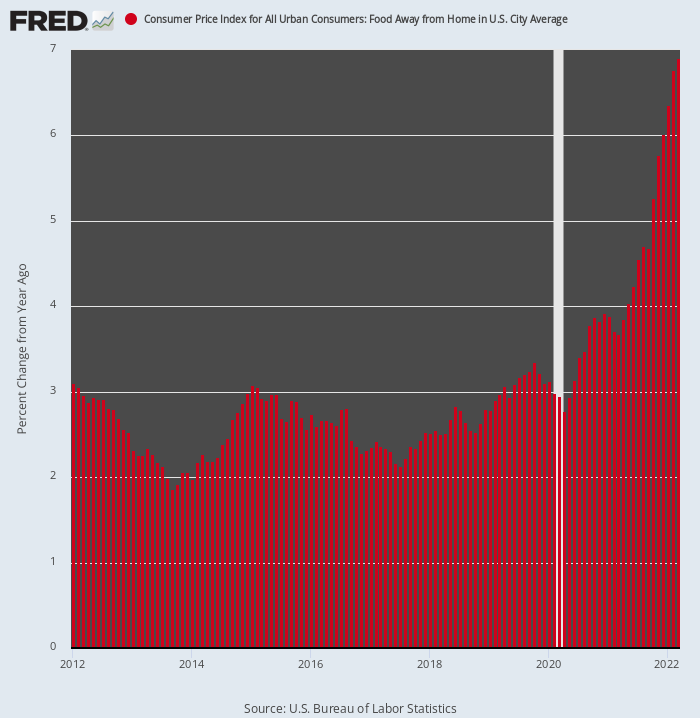
For want of doubt, here is the acceleration of inflation in the restaurant sector, tracked by the CPI under the rubric Food Away From Home. Compared to a 2-3% Y/Y gain for the eight years before February 2020, the index is now rising at a 7% annual rate.
Moreover, it is just beginning its ultimate ascent. That’s because the two main ingredients of the restaurant cost structure—food and labor—are both now rising at double-digit rates.
Needless to say, the scenario ahead is vastly different than what prevailed during the so-called “lowflation” era prior to 2020. To wit, a sector which had been an anchor on the overall inflation rate is now becoming still another booster rocket.
Y/Y Change In The CPI For Food Away From Home, 2012-2022
Finally, it needs be noted that CPI’s reported figures inherently lag prices in the real world market place whenever a step-change in direction occurs. To illustrate this, the CPI has been divided into two baskets with vastly different weightings of items depending upon whether they are considered “flexible” or “sticky.”
For instance, food and energy is considered flexible because they are ultimately priced on global auction markets. By contrast, the 31% weighting of rents are heavily imputed and lag the marketplace by at least six months owing to the survey design. Thus:
- Sticky CPI: 71.1% of the overall CPI weight with transportation, shelter and other elements accounting for 4.7%, 37.9% and 28.4% of the weightings, respectively;
- Flexible CPI: 28.9% of the overall CPI weight with automotive and energy, food, apparel and others accounting for 14.4%, 8.7%, 2.3% and 3.5% of the weightings, respectively.
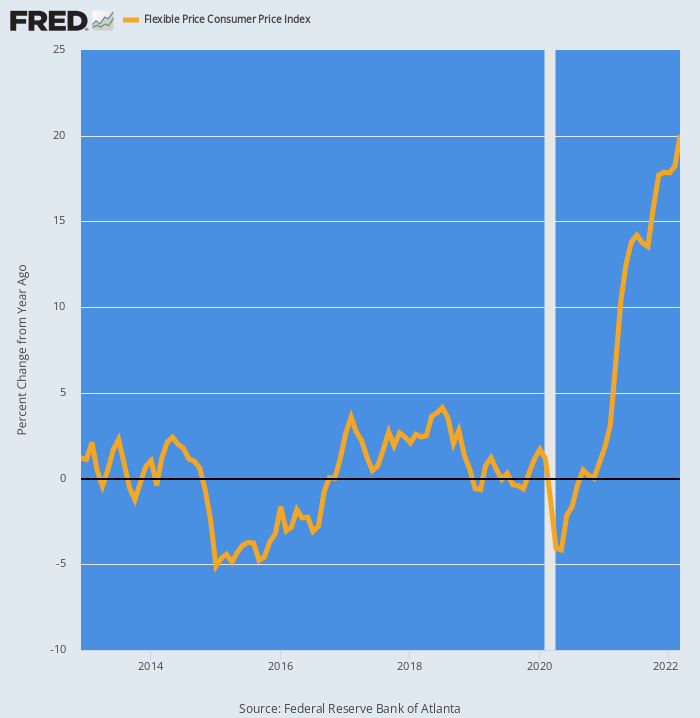
As might be expected, since February 2020, the Flexible CPI has accelerated like a booster rocket. From essentially a 0.0% rate of average annual increase between 2012 and 2019, these prices are not up by 20% on a Y/Y basis.
Y/Y Change In Flexible Price CPI, 2012-2022
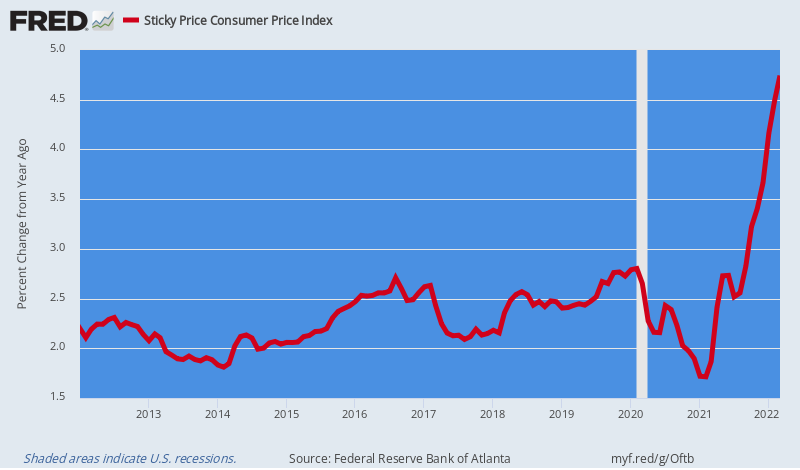
By contrast, the Sticky Price CPI, which had averaged a 2.5% Y/Y increase prior to 2020, has now modestly accelerated to 4.5% on a Y/Y basis.
But here’s the thing. The “sticky” elements of the CPI will gradually become infected with the inflationary wages, inputs prices and overhead costs that are now surging through the supply chain—rents, utilities and health care being leading examples.
Worse still, the Fed’s has a puny anti-inflation stick, and one which it is reluctant to use for fear that it will kick the macro-economy into recession. We are referring to interest rates, of course, and the overhang of $87 trillion of public and private debt that hovers over the economy like a financial Sword of Damocles.
The debt was enabled by decades of reckless money-pumping, but it now is what it is: Namely, a perceived barrier to decisive and dramatic Fed anti-inflation action.
Moreover, the latter, in turn, means that the inflationary dynamic implanted during the Covid Era and now being drastically exacerbated by Washington’s Sanctions War on the world commodity entrepot in the Black Sea, will only be compounded in the quarters ahead.
Y/Y Change In Sticky Price CPI, 2012-2022
Meanwhile, the Washington cavalry is not coming to the rescue. In fact, American governance is about to have a hard landing come November when the Dems are likely swept out of office, leaving a viscous paralysis for the next two years, even as stagflation intensifies and the global crisis triggered by the Ukraine War finds no constructive outcome.
Indeed, as Bill King noted in his morning missive, Biden is literally sinking out of sight in the polls. And the truth remains that without strong presidential leadership, our Madison system of divided government simply does not work.
Normally, that’s a wonderful thing—a check on the aggrandizing impulses of the state. But now we need drastic action to end the wars, fix the budget and reform the Fed, yet nothing of the sort is likely to happen under the circumstances that now portend.